Loading...
Research
Conduct Research Around Coffee - Japanese Coffee Market Study
Project Context
Role
UX Designer
Team
Solo project (OpenClassrooms Project)
Duration
Jan 2022Mar 2022
3 months
3 months
Tools
Pen & PaperCoggleMiro
A research project from my OpenClassrooms UX design course. Working from a course brief framed as "a multinational coffee brand is considering expanding its product line," I studied how people in Japan drink coffee through ethnography and user interviews, then synthesized the findings through competitor analysis, personas, and journey mapping.
Research Question
How do people in Japan drink coffee and what are the keys that are important to users and the pain points they face?
Research Methodology
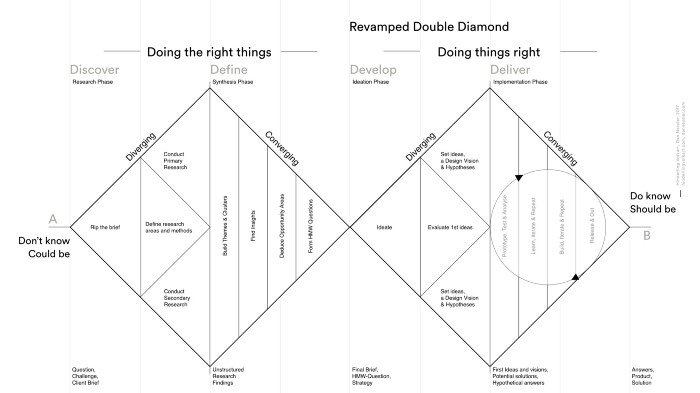
Based on the Double Diamond Design Thinking Process. First, Discover-Research phase: I conducted Secondary research (macro-environmental analysis and competitive analysis) to better understand the Japanese coffee market. Then I conducted Primary research (field observations and user interviews). After that, as the Define-Synthesis phase, I did Affinity Diagrams, Personas and Journey Maps to find insights.

The research followed the Double Diamond Design Thinking Process: Discover-Research phase (Secondary and Primary research) and Define-Synthesis phase (Affinity Diagrams, Personas, Journey Maps).
Secondary Research - Macro Analysis
Japan Coffee Consumption Trends by Type (2002-2020)
Source: Basic Survey on Coffee Demand Trends by Japan Coffee Association
| Year | Total | Instant | Regular | Liquid | Can |
|---|---|---|---|---|---|
| 2002 | 10.03 | 4.29 | 3.22 | 0.74 | 1.77 |
| 2004 | 10.43 | 4.4 | 3.49 | 0.86 | 1.68 |
| 2006 | 10.59 | 4.38 | 3.7 | 0.7 | 1.81 |
| 2008 | 10.6 | 4.51 | 3.21 | 0.82 | 2.05 |
| 2010 | 10.93 | 4.69 | 3.27 | 1.09 | 1.87 |
| 2012 | 10.73 | 4.46 | 3.2 | 1.14 | 1.93 |
| 2014 | 11.13 | 4.54 | 3.63 | 1.11 | 1.84 |
| 2016 | 11.09 | 3.95 | 3.89 | 1.51 | 1.75 |
| 2018 | 10.62 | 3.92 | 3.69 | 1.54 | 1.47 |
| 2020 | 11.53 | 4 | 4.41 | 1.97 | 1.15 |
Macro analysis examining Japanese coffee consumption patterns, including how much coffee Japanese people drink per person per week, where and how they drink it, and consumption by gender and age.
Secondary Research - PEST Analysis
PEST Analysis
Political Factors
- •Increase in consumption tax
- •Tighter regulations on smoking in restaurants (impacted by Tokyo Olympics)
Economical Factors
- •Small Business, Few Employees
- •Providing drip coffee for a major convenience store chain
- •Providing bottled coffee from beverage manufacturers
- •Barriers to entry are low, competition is fierce, and new business models are springing up one after another
- •Raising product prices to meet rising logistics costs (COVID19)
Social Factors
- •Increase Working From Home, Decrease Working at office
- •Diversification of delivery methods (full-service and self-service) to meet consumer preferences
- •Movement toward disclosure of the entire value chain to consumers (impact of SDGs)
- •Evolution of coffee, diversification of consumer choices ⇒ '1st wave', '2nd wave', '3rd wave'
- •Can't talk much in stores (COVID 19)
Technological Factors
- •Cashless payments, unattended customer service, and other contactless technologies are changing the customer experience
- •Evolution of roasting machines for home use as well as for restaurants
PEST analysis (Political, Economic, Social, Technological) examining the macro-environmental factors affecting the Japanese coffee market.
Secondary Research - Competitive Analysis
Nestle(Home and Office)


Business Model Canvas
Mission/Vision: We unlock the power of food to enhance quality of life for everyone, today and for generations to come
Business Model: Sell instant coffee, monthly subscription
Customer Segments: People who want to drink authentic coffee at home or office, popular in Japan
Price: ¥20~100 / 1 cup
Unique Value Proposition: Nescafe system (Barista Machines just setting cup) taste control by linking smartphone with the machine, capsule type
SWOT Analysis
Strengths
- • Huge brand recognition and market share
- • Strong distribution network
- • Innovative Nescafe system with app integration
Weaknesses
- • Dependency on instant coffee market
Opportunities
- • Growing home coffee market
- • Subscription model expansion
Threats
- • Competition from specialty coffee brands
Starbucks Coffee Japan(Shop)


SWOT Analysis
Strengths
- • Strong brand recognition and 'Third Place' concept
- • Digital app-based reward program
Weaknesses
- • High real estate costs in prime locations
Opportunities
- • Expansion of drive-through stores
Threats
- • Rising land prices
- • Intensified competition with full-service coffee shops like Komeda
Primary Research - Field Observation

Field observation at a coffee shop founded by a British-Japanese couple, observing customer behaviors, interactions, and the coffee shop as a 'third place' for social interaction.
Primary Research - User Interview

User interviews conducted to understand how people in Japan drink coffee, their preferences, pain points, and motivations. Multiple interview sessions were conducted to gather comprehensive insights.
Findings
Key findings include: Coffee drinkers enjoy the taste and aroma; Many people in Japan drink coffee when they are at home or at work; People who drink coffee multiple times a day are concerned about the cost and the convenience; People who drink coffee few times a day or a week want to drink authentic regular coffee to enjoy its taste and aroma; People want to drink coffee while working in the office or carry coffee to different places; Coffee shop is the third place.
Coffee Consumption Patterns
- •Many people in Japan drink coffee when they are at home or at work
- •People who drink coffee multiple times a day are concerned about the cost and the convenience
- •People who drink coffee few times a day or a week want to drink authentic regular coffee to enjoy its taste and aroma
Coffee Experience & Quality
- •Coffee drinkers enjoy the taste and aroma
- •People want to drink coffee while working in the office or carry coffee to different places
Coffee Shop as Social Space
- •Coffee shop is the third place
- •Great place for conversation
- •A place to read books
First iteration of affinity diagram, clustering user research data into themes and patterns.
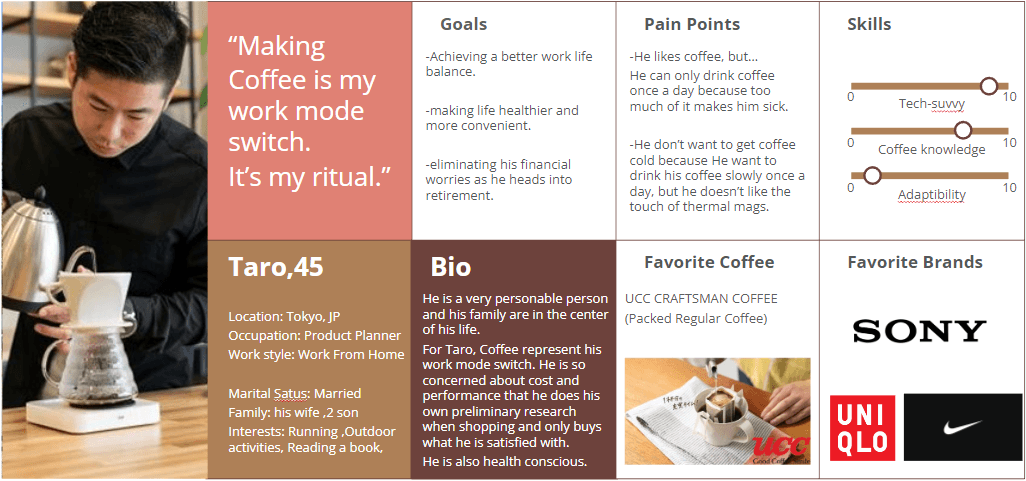
Taro
45 years old, Product Planner
A personable, health-conscious product planner who views coffee as a psychological ritual for work focus.
Click to view details
First persona profile representing a type of coffee drinker in Japan, created based on research findings.
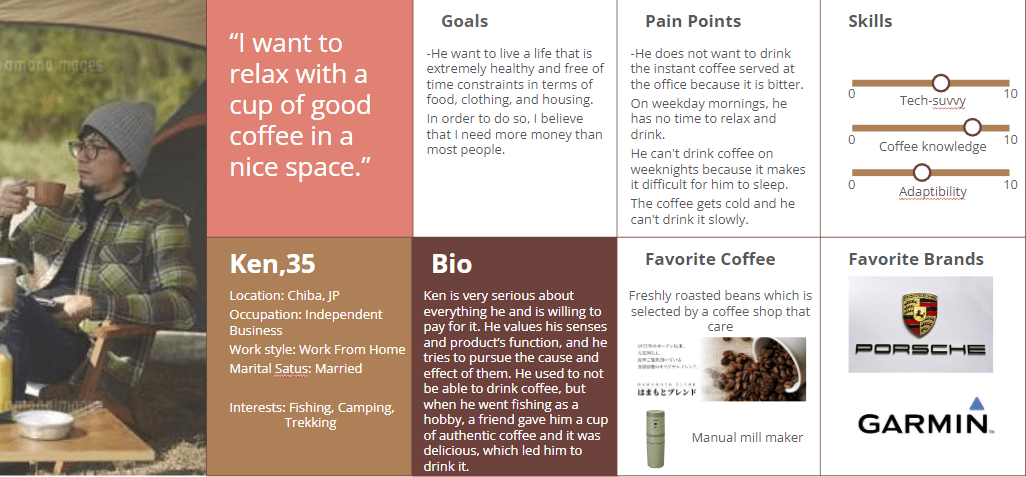
Ken
32 years old, UI/UX Designer
An efficiency-driven creative who enjoys technical brewing methods as a form of active meditation.
Click to view details
Second persona profile representing another type of coffee drinker in Japan, focusing on different consumption patterns and motivations.
Journey Map Structure
Vertical Axis
Emotional state throughout the coffee shop visit experience
Scale: -2 ~ 2
Horizontal Axis
Stages of the coffee shop visit journey
Graph Type
Line graph showing emotional journey throughout the experience
1
1.0
Planning
😊Actions: Want to work on the weekends while having a change of scenery. Decide to go to coffee shop and work there.
Thoughts
- “I don't want to stay home since I have been home all week.”
Touchpoints
- •Home
- •Mental Decision
2
2.0
Considering coffee shop
😊Actions: Check Instagram and decide where to get coffee. Get ready to go out (makeup). Head for the coffee shop by foot.
Thoughts
- “want to go someplace where I can focus on my work.”
- “want to go to a stylish place.”
- “To go to a fashionable place, need makeup.”
Touchpoints
- •Cosmetics
- •Street
3
-1.0
Considering menu
😞Actions: Enters the coffee shop. Wait in line. Look at the menu on the desk and decide an order.
Thoughts
- “there are too many people. It takes time.”
Touchpoints
- •Store Entrance
- •Queue
- •Menu
Pain Points
- •It's hard to enjoy a stylish atmosphere when it's full of people. She's hoping it's not full of people there.
- •get frustrated waiting in lines
4
-1.5
Purchasing
😞Actions: talk to the Barista and order coffee and others. Decide how to pay and wait for coffee. Receive coffee.
Thoughts
- “The person in front of me was also waiting for coffee.”
Touchpoints
- •Barista
- •POS Register
- •Payment
Pain Points
- •Process Friction: The wait continues after ordering.
5
-2.0
Find seat
😞Actions: Take her seat and drink coffee and work. Find seat.
Thoughts
- “There are too many people”
Touchpoints
- •Seating Area
- •Crowd
Pain Points
- •get frustrated waiting in lines and not being able to find a seat easily.
Opportunities
- •It is perceived as a place where you can work in a coffee shop.
Detailed journey map of a typical visit to coffee shop. This journey map illustrates the coffee drinking experience, from discovery to consumption, identifying touchpoints, emotions, pain points, and opportunities for improvement. The map structure includes vertical axis (emotions/satisfaction), horizontal axis (stages/touchpoints), and a graph visualization showing the emotional journey throughout the experience.
Key Findings

Key findings synthesized from the research, including: Coffee drinkers enjoy taste and aroma; Many people drink coffee at home or work; Cost and convenience concerns for frequent drinkers; Desire for authentic coffee for occasional drinkers; Coffee shop as third place.
Recommendations
Gather more participants (number of interviewees, rural area, various age range)
Advertising campaigns and communication strategies centered on television, social network services, and promotions (people are not going to go where they don't know what they want to get)
Sales promotion of decaffeinated coffee with authentic taste and aroma
Product development and sales promotion of a water bottle that does not oxidize even when filled with coffee
Promotion or Subscription campaign with mag manufacturers (thermo mugs that are pleasant to the touch without a metallic feel, Thermo mug that continuously displays the correct temperature)
Learnings
Through this course project, I learned a research pattern for understanding what users think, their needs and concerns — moving from secondary research, to primary research, to synthesis.
With feedback from my mentor, I practiced building personas from target-audience interview data and using them as the foundation for later decisions.